

One watt per foot of LED strip, lit around the clock, costs about $1.42 per foot per year at the 2026 US commercial average. That is the LED strip electricity cost in one number: strip watts plus the driver’s loss, times the hours it burns, times the local commercial rate. Everything else adjusts one of those four.
Most consumer calculators that rank for this question use residential rates, a few hours a day and no driver. Commercial jobs run longer, pay a different rate and lose part of every watt in the supply, so their numbers come out several times higher, and in a hotel corridor the annual figure has a comma in it.
The Formula, With the Driver In It
Start from the strip’s rated watts per foot on the datasheet, not from the driver’s nameplate:
- Strip load in watts = rated W/ft × feet installed.
- Watts at the panel = strip load ÷ driver efficiency.
- kWh per year = watts at the panel × hours per year ÷ 1,000.
- Cost per year = kWh × the rate in dollars per kWh.
Take one foot of a 2.9 W/ft strip on a 24/7 corridor: 2.9 W ÷ 0.86 is 3.37 W at the panel, and 3.37 W × 8,760 hours is about 29.5 kWh a year for that single foot.
Step 2 is the one consumer calculators skip. A driver turns line voltage into 24V and loses some of it as heat. Mean Well’s LPV-60-24, a common 60 W, 24V supply, lists a typical efficiency of 86% on its specification sheet, measured at 230VAC and full load, so expect a little lower on a 120V job, and our drivers page lists typical efficiencies by class from about 82 percent (40 W Class 2) to about 90 percent (400 W linear); at 86%, every 100 W of strip draws about 116 W at the panel. Our drivers page sizes supplies at no more than 80% of their rating but does not publish efficiency, so use the datasheet of the driver actually on the job; a better supply shrinks the loss in proportion.
The driver loss is real money on a long run. On the hotel corridor priced below, the 14% loss alone is about 1,650 kWh a year.
One Number to Remember
Divide the formula by feet and by watts per foot, and it collapses to one figure per schedule and per rate. These are kWh and dollars per foot per year for each watt per foot of strip, with an 86% driver; the kWh column works with any rate:
| Hours per year | Schedule | kWh per foot | U.S. average (13.97¢) | California (26.39¢) | Texas (8.56¢) |
|---|---|---|---|---|---|
| 8,760 | 24/7: corridors, stairs, lobbies, signs | 10.2 | $1.42 | $2.69 | $0.87 |
| 4,380 | 12 h every day: retail, restaurants | 5.1 | $0.71 | $1.34 | $0.44 |
| 3,120 | 12 h weekdays: offices, schools | 3.6 | $0.51 | $0.96 | $0.31 |
Multiply the row by the strip’s W/ft and the footage. A 2.9 W/ft strip on 200 ft of 24/7 corridor at the U.S. average is 2.9 × 200 × $1.42, about $824 a year. The same strip in an office on weekday hours is about $296.
Which Rate to Use
The rate in those columns is the U.S. Energy Information Administration’s average price to commercial customers, year to date through July 2026, still marked preliminary: 13.97¢ per kWh nationally, against 13.23¢ for the same months of 2025. The spread between states is wider than any difference between strips:
| State | Commercial, ¢/kWh, YTD July 2026 |
|---|---|
| California | 26.39 |
| Massachusetts | 24.73 |
| New York | 22.91 |
| Illinois | 13.95 |
| Arizona | 12.14 |
| Washington | 11.87 |
| Florida | 11.78 |
| Georgia | 11.70 |
| Nevada | 9.29 |
| Texas | 8.56 |
Know what that average is. EIA derives it by dividing utility revenue from retail sales by the kWh sold, and its notes say the revenue includes all charges and taxes collected. It is an average across every commercial customer, not a tariff, and EIA itself says averages differ from rates. For an estimate in a proposal, the EIA state figure is honest and citable. For a number the owner will hold you to, take the blended cost per kWh from twelve months of the owner’s own bills, which already carries the demand charges and riders their tariff adds.
That blended figure matters more for lighting than for most loads. A cove that is on day and night is a steady load through every peak period the tariff prices, so an owner on a time-of-use or demand tariff pays it at the expensive hours as well as the cheap ones. The bills settle the question for that building; an average does not.
Three Jobs, Priced by the Year
Three typical jobs, each with the strip a contractor would plausibly use and the hours the space actually runs, at an 86% driver:
| Job | Strip | Length | Strip load | Hours/yr | kWh/yr | U.S. | CA | NY | FL | TX |
|---|---|---|---|---|---|---|---|---|---|---|
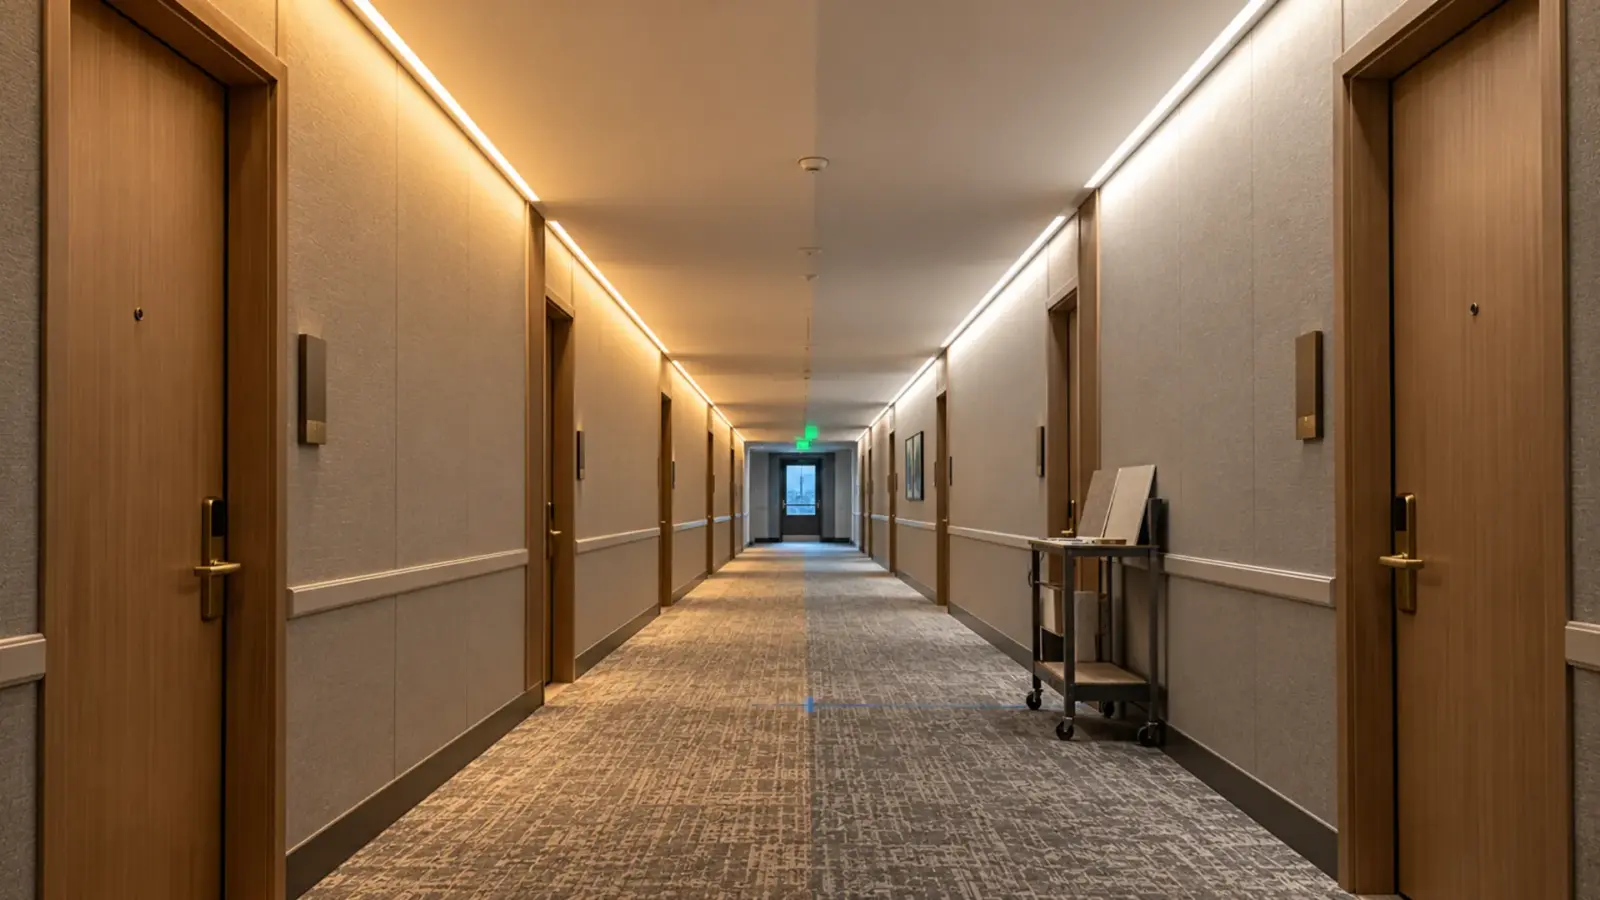
| Hotel corridor coves, both walls, never off | UT-S2835-128-HE, 2.9 W/ft | 400 ft | 1,160 W | 8,760 | 11,816 | $1,651 | $3,118 | $2,707 | $1,392 | $1,011 |
| Mall tenant store, shelf lines | UT-C480-8, 3.2 W/ft | 160 ft | 512 W | 4,380 | 2,608 | $364 | $688 | $597 | $307 | $223 |
| Office floor coves | UT-C320-8, 2.4 W/ft | 250 ft | 600 W | 3,120 | 2,177 | $304 | $574 | $499 | $256 | $186 |
- 1Strip2.9 W/ft × 400 ft1,160 W
- 2At the panel÷ 0.86 driver1,349 W
- 3Per year× 8,760 h11,816 kWh
- 4Cost× 13.97¢ (EIA, YTD Jul 2026)about $1,651 a year
The corridor costs more than five times the office although its strip load is less than twice as large. Hours did that. In California the corridor column is a ceiling, not a design: Title 24 requires hotel guest-room corridors to cut lighting power by at least half when unoccupied, so a compliant corridor runs fewer full-output hours. That is why corridors, stair towers, lobbies, parking structures and signs are where strip choice and controls pay off, and why an office cove is rarely worth a premium strip on energy alone. Our installed cost guide covers the other side of the ledger, what the job costs to build.
Efficacy Is the Lever
The fair comparison between strips is dollars per unit of light, not per foot. Efficacy, lumens per watt, sets how many watts a thousand lumens costs, and from there the formula gives a yearly price:
| Strip efficacy | Watts per 1,000 lm | Per 1,000 lm per year, 24/7, U.S. | Same, California |
|---|---|---|---|
| 190 lm/W (UT-S2835-128-HE) | 5.3 W | $7.49 | $14.15 |
| 130 lm/W (UT-SC320HE-15, low end) | 7.7 W | $10.95 | $20.68 |
| 105 lm/W (UT-SC320CRI97-15, Ra≥97) | 9.5 W | $13.55 | $25.60 |
Take the hotel corridor again. UT-S2835-128-HE at 2.9 W/ft and 190 Lumens per watt: how much light the strip gives for the power it draws. Higher means less heat and less driver load per foot. puts out about 551 lumens per foot, 220,400 lumens over 400 ft. Delivering the same lumens from a 105 lm/W strip takes about 2,099 W instead of 1,160 W. Running 24/7, the difference is about 9,570 kWh a year, roughly $1,336 at the U.S. average and $2,524 in California, every year the corridor is lit.
That does not make the high-efficacy strip the right answer everywhere. The 105 lm/W row is a Ra≥97 strip, chosen for color rendering where finishes, food or skin tones matter; our high-CRI guide explains when that is worth the watts. And catalog efficacy is a rated figure; our lumens per watt guide explains why delivered output in a channel and behind a diffuser is lower. Compare strips at the same diffuser and the same channel, and the ranking holds.
Tunable and Color Strip
Two-channel and color strip need one more step, because the rated W/ft on the datasheet is usually every channel at full. Our tunable white UT-T624-8 is listed at 4.3 W/ft, written as 7+7 W/m: each of the warm and cool channels at full. Our tunable page explains that the listed figure is the total of both channels: about half at pure 2700K or pure 6500K, and full output at a mid mix on a plain two-channel controller. Price tunable strip from the scenes the schedule will actually use, measured at the driver input, and use the full both-channel figure only as the ceiling for sizing supplies.
Color strip follows the same logic. An RGBW cove that spends most of its life on one saturated color draws less than its all-channels rating; one that sits on the white channel with color added draws closer to its full rating. Again, measure the scenes that matter, and keep the full rating for sizing the supply and the circuit.
Hours and Controls
Hours are the largest number in the formula and the easiest to change. A corridor cove at full output 24/7 is the expensive case; the same cove on an occupancy sensor that drops to a low level when the floor is empty burns fewer full-output hours. Energy codes push the same direction: California’s Title 24, section 130.1(c), requires shutoff controls in many commercial spaces and partial-off controls in corridors, stairwells and parking areas, and our occupancy sensor guide works through switching a driver versus dimming it.
Price controls with measured watts, not with the dimmer’s percentage. The power a dimmed strip draws depends on the driver and the dimming method, and the driver’s own losses may not fall in step with the light. Clamp a meter on the driver’s input circuit at full and at the dimmed level the schedule will use, write both down, and put those two numbers into the formula with the hours each level runs. That is a savings figure an owner’s energy consultant will accept.
Where Estimates Go Wrong
Four mistakes cover most bad numbers:
- Residential rates. EIA’s U.S. residential average for the same 2026 months is 18.19¢, against 13.97¢ commercial, and neither is the owner’s tariff. Use the commercial figure or the owner’s bills.
- Driver nameplate as the load. A 60 W driver feeding 40 W of strip does not draw 60 W. Use strip watts, then divide by efficiency. On many drivers the efficiency curve also drops at light load, so read the curve when a driver is loaded far below the 80% target.
- Short hours. Consumer calculators usually assume a few hours a day. A lobby or a sign that is never switched off runs 8,760.
- Rated versus measured. The W/ft on the datasheet is at rated voltage. A constant-voltage strip at the far end of a long run, with less voltage, draws less and gives less light, as our voltage drop guide explains. On a job where the bill matters, measure the input watts once the system is commissioned.
Heat counts too. A driver in a hot ceiling space has to be derated and ages faster, which our driver derating guide covers; it is one more reason to put drivers where they can breathe.
Putting It in a Proposal
An owner or an energy consultant will check four inputs, so state them: the strip’s W/ft and footage from the schedule, the driver efficiency and whose datasheet it came from, the hours per year and what schedule they assume, and the rate with its source and date. A line such as “400 ft at 2.9 W/ft, 86% driver efficiency (manufacturer datasheet), 8,760 h, 13.97¢/kWh (EIA commercial, U.S., year to date July 2026)” lets anyone redo the number and swap in their own rate. Give the kWh as well as the dollars; the kWh does not age when rates change.
Rules of Thumb
- At the 2026 U.S. commercial average, each watt per foot run 24/7 costs about $1.42 per foot per year; halve it for 12-hour days, about a third of it for office hours.
- Add about 16% for the driver unless its datasheet says otherwise.
- The state rate moves the answer more than the strip does; California is about three times Texas.
- Price light, not feet: dollars per 1,000 lumens per year is the comparison that matters.
- Corridors, stairs, lobbies and signs are where efficacy and controls pay back; office coves rarely do on energy alone.
The strips priced here are in our SMD LED strip and COB LED strip ranges, with watts per foot for each model and efficacy where we list it.